Water Delineation “proof of concept”#
License: CC-BY-4.0
Github: BenjMy/centum
Subject: Tutorial
Authors:
Benjamin Mary
Email: benjamin.mary@ica.csic.es
ORCID: 0000-0001-7199-2885
Affiliation: ICA-CSIC
Date: 2025/01/10
import numpy as np
import pooch
import xarray as xr
import matplotlib.pyplot as plt
from centum import plotting as pltC
from centum.irrigation_district import IrrigationDistrict
from centum import irrigation_district as irr_geo_tools
from centum.delineation import ETAnalysis
Open datasets#
pooch_Majadas = pooch.create(
    path=pooch.os_cache("POC_project"),
    base_url="https://github.com/BenjMy/test_AQUACROP_centum_dataset/raw/refs/heads/main/",
    registry={
        "ds_analysis_EO_0.netcdf": None,
        "ds_analysis_baseline_0.netcdf": None,
    },
)
filename = pooch_Majadas.fetch('ds_analysis_EO_0.netcdf')
ds_analysis_EO = xr.load_dataset(filename)

filename = pooch_Majadas.fetch('ds_analysis_baseline_0.netcdf')
ds_analysis_baselin = xr.load_dataset(filename)
Downloading file 'ds_analysis_EO_0.netcdf' from 'https://github.com/BenjMy/test_AQUACROP_centum_dataset/raw/refs/heads/main/ds_analysis_EO_0.netcdf' to '/home/runner/.cache/POC_project'.
/tmp/ipykernel_2310/2650687659.py:10: FutureWarning: In a future version, xarray will not decode timedelta values based on the presence of a timedelta-like units attribute by default. Instead it will rely on the presence of a timedelta64 dtype attribute, which is now xarray's default way of encoding timedelta64 values. To continue decoding timedeltas based on the presence of a timedelta-like units attribute, users will need to explicitly opt-in by passing True or CFTimedeltaCoder(decode_via_units=True) to decode_timedelta. To silence this warning, set decode_timedelta to True, False, or a 'CFTimedeltaCoder' instance.
  ds_analysis_EO = xr.load_dataset(filename)
Downloading file 'ds_analysis_baseline_0.netcdf' from 'https://github.com/BenjMy/test_AQUACROP_centum_dataset/raw/refs/heads/main/ds_analysis_baseline_0.netcdf' to '/home/runner/.cache/POC_project'.
/tmp/ipykernel_2310/2650687659.py:13: FutureWarning: In a future version, xarray will not decode timedelta values based on the presence of a timedelta-like units attribute by default. Instead it will rely on the presence of a timedelta64 dtype attribute, which is now xarray's default way of encoding timedelta64 values. To continue decoding timedeltas based on the presence of a timedelta-like units attribute, users will need to explicitly opt-in by passing True or CFTimedeltaCoder(decode_via_units=True) to decode_timedelta. To silence this warning, set decode_timedelta to True, False, or a 'CFTimedeltaCoder' instance.
  ds_analysis_baselin = xr.load_dataset(filename)
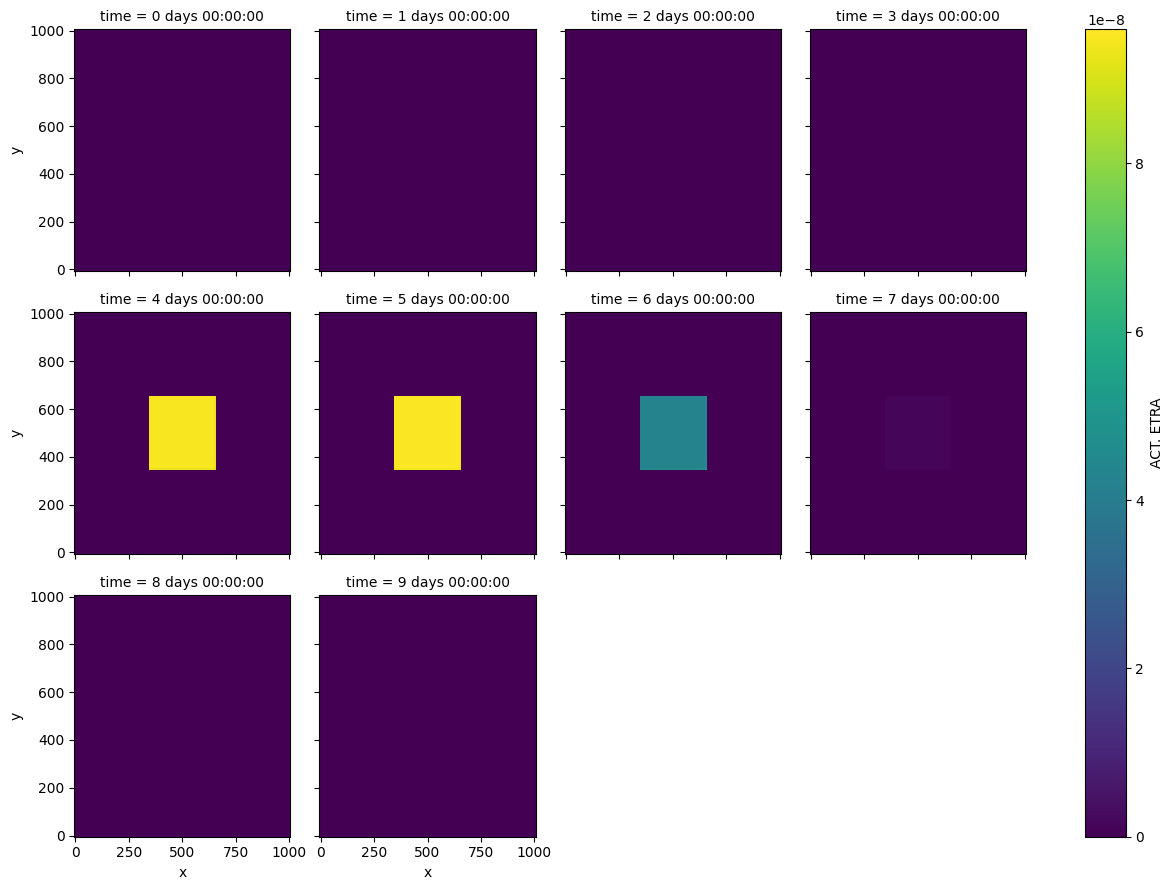
Show Earth Observation time serie to analyse#
_, index = np.unique(ds_analysis_EO['time'], return_index=True)
ds_analysis_EO = ds_analysis_EO.isel(time=index)

ds_analysis_EO['ACT. ETRA'].plot.imshow(x="x", y="y",
                                        col="time",
                                        col_wrap=4,
                                        )
<xarray.plot.facetgrid.FacetGrid at 0x7fef2f7dfeb0>
Irrigation delineation#
Technical Basis of the irrigation_delineation Module
The irrigation_delineation module is designed to analyze evapotranspiration (ET) data, compute ratios between actual evapotranspiration (ETa) and potential evapotranspiration (ETp), and classify events (e.g., irrigation, rain). This is achieved through spatial and temporal analysis using xarray datasets. Below is a detailed breakdown of the module’s functionality.
Steps
Compute ETa/ETp ratios locally and regionally.
Identify significant changes in ETa/ETp ratios using thresholds.
Apply rolling temporal averages to smooth data.
Classify events as irrigation, rain, or no event based on logical rules.
scenario_analysis_usingET = ETAnalysis()
decision_ds, event_type = scenario_analysis_usingET.irrigation_delineation(ds_analysis_EO)
---------------------------------------------------------------------------
KeyError                                  Traceback (most recent call last)
/opt/hostedtoolcache/Python/3.10.18/x64/lib/python3.10/site-packages/xarray/core/dataset.py in ?(self, name)
   1154             variable = self._variables[name]
   1155         except KeyError:
-> 1156             _, name, variable = _get_virtual_variable(self._variables, name, self.sizes)
   1157

KeyError: 'ETa'

During handling of the above exception, another exception occurred:

KeyError                                  Traceback (most recent call last)
File /opt/hostedtoolcache/Python/3.10.18/x64/lib/python3.10/site-packages/xarray/core/dataset.py:1261, in Dataset.__getitem__(self, key)
   1260 try:
-> 1261     return self._construct_dataarray(key)
   1262 except KeyError as e:

File /opt/hostedtoolcache/Python/3.10.18/x64/lib/python3.10/site-packages/xarray/core/dataset.py:1156, in Dataset._construct_dataarray(self, name)
   1155 except KeyError:
-> 1156     _, name, variable = _get_virtual_variable(self._variables, name, self.sizes)
   1158 needed_dims = set(variable.dims)

File /opt/hostedtoolcache/Python/3.10.18/x64/lib/python3.10/site-packages/xarray/core/dataset_utils.py:79, in _get_virtual_variable(variables, key, dim_sizes)
     78 if len(split_key) != 2:
---> 79     raise KeyError(key)
     81 ref_name, var_name = split_key

KeyError: 'ETa'

The above exception was the direct cause of the following exception:

KeyError                                  Traceback (most recent call last)
/tmp/ipykernel_2310/2577214387.py in ?()
      1 scenario_analysis_usingET = ETAnalysis()
----> 2 decision_ds, event_type = scenario_analysis_usingET.irrigation_delineation(ds_analysis_EO)

/opt/hostedtoolcache/Python/3.10.18/x64/lib/python3.10/site-packages/centum-0.1.6-py3.10.egg/centum/delineation.py in ?(self, decision_ds, threshold_local, threshold_regional, time_window)
    379                                time_window=10,
    380                                ):
    381
    382         # Compute local and regional ETa/ETp ratios
--> 383         decision_ds = self.compute_ratio_ETap_local(decision_ds,time_window=time_window)
    384         decision_ds = self.compute_ratio_ETap_regional(decision_ds,time_window=time_window)
    385
    386         # Apply local and regional threshold decision rules

/opt/hostedtoolcache/Python/3.10.18/x64/lib/python3.10/site-packages/centum-0.1.6-py3.10.egg/centum/delineation.py in ?(self, ds_analysis, ETa_name, ETp_name, time_window)
     54         xr.Dataset
     55             The dataset with added local ETa/ETp ratio and temporal differences.
     56         """
     57         # Compute the local ratio of ETa/ETp
---> 58         ds_analysis["ratio_ETap_local"] = ds_analysis[ETa_name] / ds_analysis[ETp_name]
     59
     60         # Compute the absolute temporal difference of the local ratio
     61         ds_analysis["ratio_ETap_local_diff"] = abs(

/opt/hostedtoolcache/Python/3.10.18/x64/lib/python3.10/site-packages/xarray/core/dataset.py in ?(self, key)
   1270
   1271                 # If someone attempts `ds['foo' , 'bar']` instead of `ds[['foo', 'bar']]`
   1272                 if isinstance(key, tuple):
   1273                     message += f"\nHint: use a list to select multiple variables, for example `ds[{list(key)}]`"
-> 1274                 raise KeyError(message) from e
   1275
   1276         if utils.iterable_of_hashable(key):
   1277             return self._copy_listed(key)

KeyError: "No variable named 'ETa'. Did you mean one of ('ETp',)?"
Hint
Steps
The final decision_ds xarray dataset includes:
Local and regional ETa/ETp ratios.
Temporal differences of these ratios.
Boolean thresholds for decision-making.
Classified events (irrigation, rain, or no event).
print(decision_ds)
<xarray.Dataset> Size: 10MB
Dimensions:                                   (time: 9, x: 101, y: 101)
Coordinates:
  * time                                      (time) timedelta64[ns] 72B 1 da...
  * x                                         (x) float64 808B 0.0 ... 1e+03
  * y                                         (y) float64 808B 0.0 ... 1e+03
Data variables: (12/19)
    index                                     (time, x, y) float64 734kB 3.05...
    time_sec                                  (time, x, y) float64 734kB 8.65...
    SURFACE NODE                              (time, x, y) float64 734kB 1.01...
    ACT. ETRA                                 (time, x, y) float64 734kB 0.0 ...
    ETp                                       (time, x, y) float64 734kB -1e-...
    ratio_ETap_local                          (time, x, y) float64 734kB -0.0...
    ...                                        ...
    condRain1                                 (time, x, y) bool 92kB False .....
    condRain2                                 (time, x, y) bool 92kB False .....
    condRain                                  (time, x, y) bool 92kB False .....
    condIrrigation1                           (time, x, y) bool 92kB False .....
    condIrrigation2                           (time, x, y) bool 92kB False .....
    condIrrigation                            (time, x, y) bool 92kB False .....
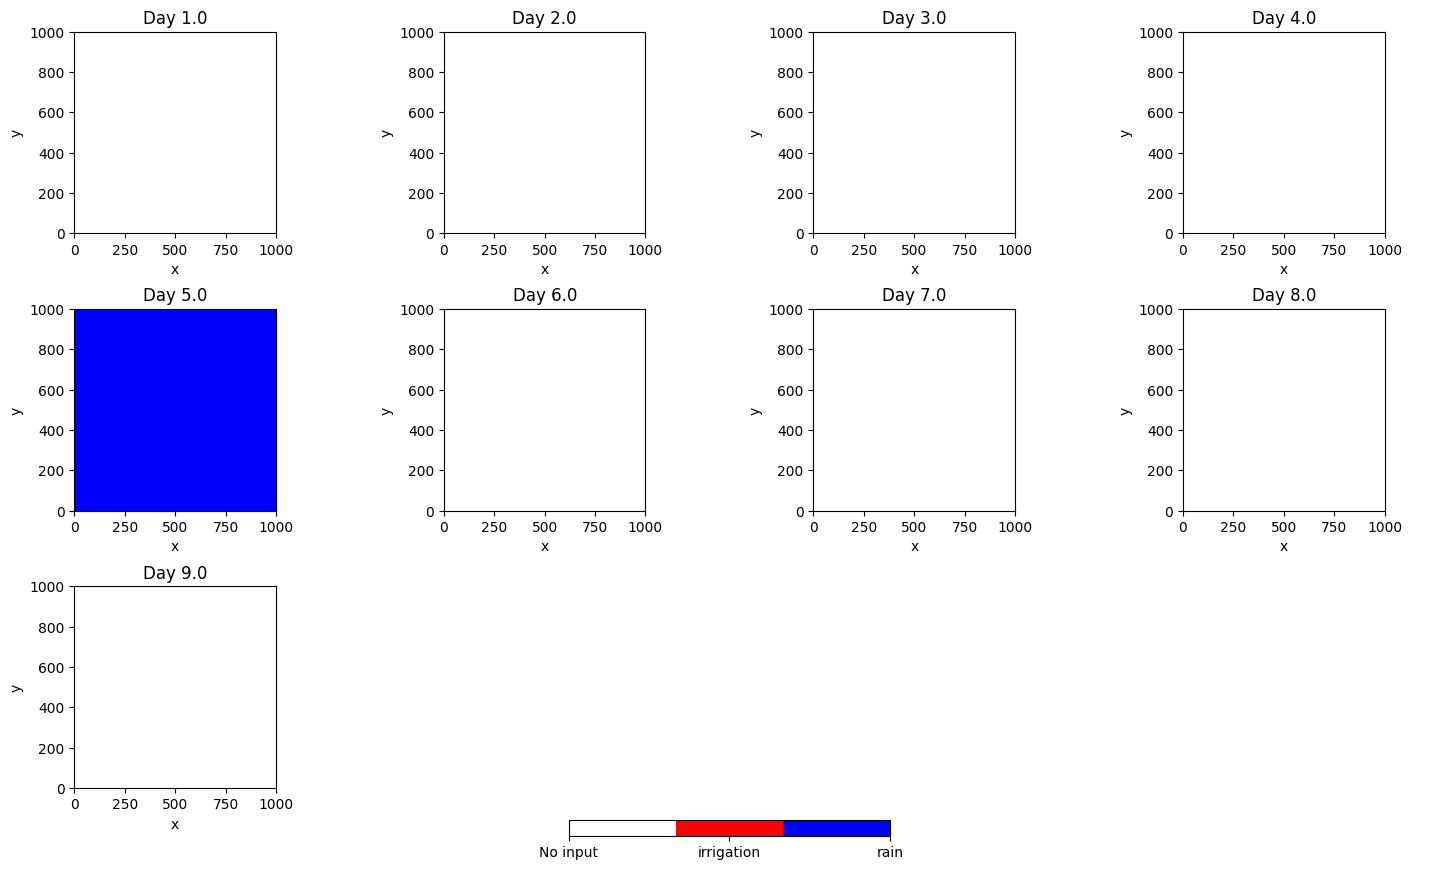
Plot results of event detection#
ncols = 4
time_steps = event_type.time.size
nrows = int(np.ceil(time_steps / ncols))  # Number of rows needed
fig, axes = plt.subplots(nrows=nrows, ncols=ncols,
                         figsize=(15, nrows * 3)
                         )
pltC.plot_irrigation_schedule(event_type,time_steps,fig,axes)
Prepare geographic analysis of irrigation districts#
GeoAnalysis = IrrigationDistrict("../../data/synthetic/area_SC0.shp")
gdf_irr = GeoAnalysis.load_shapefile()
resolution = event_type.rio.resolution()[0]
bounds = gdf_irr.total_bounds  # (minx, miny, maxx, maxy)
gdf_irr['index'] = gdf_irr.index.values
rioxr_irrigation = GeoAnalysis.convert_to_rioxarray(gdf=gdf_irr,
                                                    variable="index",
                                                    resolution=resolution,
                                                    bounds=bounds
                                                    )
rioxr_irrigation = rioxr_irrigation.rio.write_crs("EPSG:4326")
event_type = event_type.rio.write_crs("EPSG:4326")
rioxr_irrigation= rioxr_irrigation.rio.reproject_match(event_type)
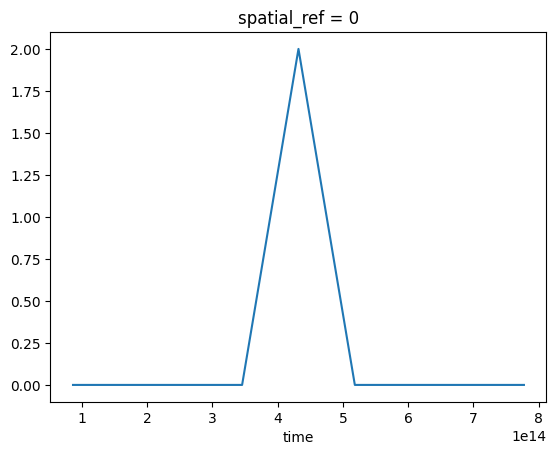
Show result for a given district#
mask_IN = irr_geo_tools.get_mask_IN_patch_i(rioxr_irrigation,
                                            patchid=1
                                            )
mask_IN = rioxr_irrigation==1
mask_OUT = irr_geo_tools.get_mask_OUT(rioxr_irrigation,
                                      )

event_type_node_IN = event_type.where(mask_IN, drop=True).mean(['x','y'])
event_type_node_OUT = event_type.where(mask_OUT, drop=True).mean(['x','y'])
event_type_node_IN.plot()
[<matplotlib.lines.Line2D at 0x7f680064ddf0>]