Note
Go to the end to download the full example code.
Changing mesh properties (resolution, coordinates, …)#
Weill, S., et al. « Coupling Water Flow and Solute Transport into a Physically-Based Surface–Subsurface Hydrological Model ». Advances in Water Resources, vol. 34, no 1, janvier 2011, p. 128‑36. DOI.org (Crossref), https://doi.org/10.1016/j.advwatres.2010.10.001.
This example shows how to use pyCATHY object to mesh from a DEM and run the hydrological model.
Estimated time to run the notebook = 5min
# !! run preprocessor change the DEM shape !
# dtm_13 does not have the same shape anymore!

import os

import matplotlib.pyplot as plt
import numpy as np
import pandas as pd

import pyCATHY.meshtools as mt
from pyCATHY import cathy_tools
from pyCATHY.importers import cathy_inputs as in_CT
from pyCATHY.importers import cathy_outputs as out_CT
from pyCATHY.plotters import cathy_plots as cplt
path2prj = "../SSHydro/"  # add your local path here
simu = cathy_tools.CATHY(dirName=path2prj,
                    prj_name="meshing_from_weill"
                            )

rootpath = os.path.join(simu.workdir + simu.project_name)
🏁 Initiate CATHY object
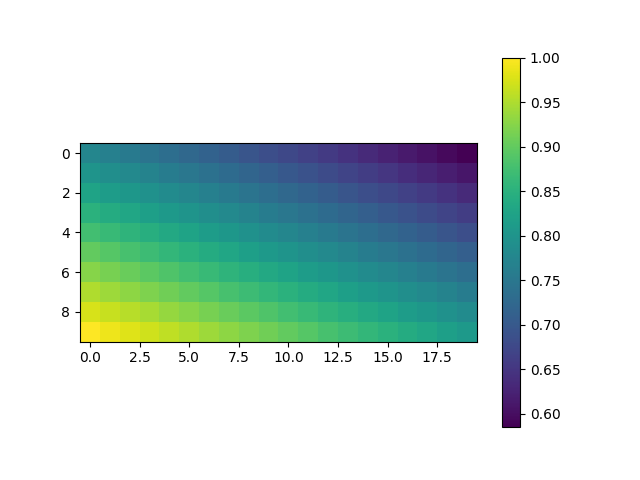
the dimension of the mesh is squared (20,20)
dem_mat, str_hd_dem = in_CT.read_dem(
os.path.join(simu.workdir, simu.project_name, "prepro/dem"),
os.path.join(simu.workdir, simu.project_name, "prepro/dtm_13.val"),
)
fig, ax = plt.subplots(1)
img = ax.imshow(dem_mat)
plt.colorbar(img)
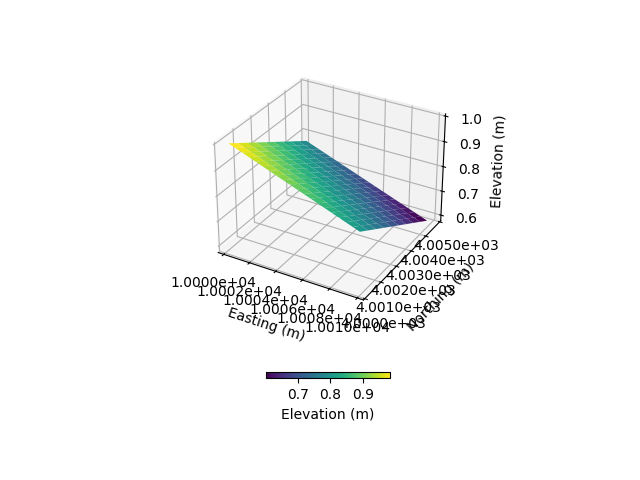
simu.show_input(prop="dem")
simu.update_prepo_inputs(
DEM=dem_mat,
# N=np.shape(dem_mat)[1],
# M=np.shape(dem_mat)[0],
)
fig = plt.figure()
ax = plt.axes(projection="3d")
simu.show_input(prop="dem", ax=ax)
simu.create_mesh_vtk(verbose=True)

🔄 Update hap.in file
🔄 Update dem_parameters file
🔄 Update dem_parameters file
🔄 Update hap.in file
🔄 Update dem_parameters file
🔄 Update dtm_13 file
🔄 update zone file
🔄 Update dem_parameters file
🔄 Update parm file
🔄 Update dem_parameters file
🍳 gfortran compilation
👟 Run preprocessor

 wbb...

 searching the dtm_13.val input file...
 assigned nodata value =  -9999.0000000000000

 number of processed cells =         200

 ...wbb completed

 rn...
 csort I...
 ...completed

 depit...
 dem modifications =            0
 dem modifications =            0 (total)
 ...completed

 csort II...
 ...completed

 cca...

 contour curvature threshold value =    9.99999996E+11
 ...completed

 smean...
 mean (min,max) facet slope =  0.050445386 ( 0.020000000, 0.053851648)
 ...completed

 dsf...
 the drainage direction of the outlet cell (           8 ) is used
 ...completed

 hg...
 ...completed

 saving the data in the basin_b/basin_i files...

 ...rn completed

 mrbb...


 Select the header type:
 0) None
 1) ESRI ascii file
 2) GRASS ascii file
 (Ctrl C to exit)

 ->
 Select the nodata value:
 (Ctrl C to exit)

 ->
 Select the pointer system:
 1) HAP system
 2) Arc/Gis system
 (Ctrl C to exit)

 ->  ~~~~~~~~~~~~~~~~~~~~~~~~~~~~~~~~~~~~~~~~~~

 dem file

 min value = 0.585000E+00
 max value = 0.100000E+01
 number of cells =   200
 mean value = 0.792500E+00

 writing the output file...

 ~~~~~~~~~~~~~~~~~~~~~~~~~~~~~~~~~~~~~~~~~~

 lakes_map file

 min value =     0
 max value =     0
 number of cells =   200
 mean value =     0.000000

 writing the output file...

 ~~~~~~~~~~~~~~~~~~~~~~~~~~~~~~~~~~~~~~~~~~

 zone file

 min value =     1
 max value =     1
 number of cells =   200
 mean value =     1.000000

 writing the output file...

 ~~~~~~~~~~~~~~~~~~~~~~~~~~~~~~~~~~~~~~~~~~

 dtm_w_1 file

 min value = 0.515524E+00
 max value = 0.100000E+01
 number of cells =   200
 mean value = 0.651177E+00

 writing the output file...

 ~~~~~~~~~~~~~~~~~~~~~~~~~~~~~~~~~~~~~~~~~~

 dtm_w_2 file

 min value = 0.000000E+00
 max value = 0.484476E+00
 number of cells =   200
 mean value = 0.348823E+00

 writing the output file...

 ~~~~~~~~~~~~~~~~~~~~~~~~~~~~~~~~~~~~~~~~~~

 dtm_p_outflow_1 file

 min value =     4
 max value =     8
 number of cells =   200
 mean value =     4.400000

 writing the output file...

 ~~~~~~~~~~~~~~~~~~~~~~~~~~~~~~~~~~~~~~~~~~

 dtm_p_outflow_2 file

 min value =     0
 max value =     9
 number of cells =   200
 mean value =     6.885000

 writing the output file...

 ~~~~~~~~~~~~~~~~~~~~~~~~~~~~~~~~~~~~~~~~~~

 A_inflow file

 min value = 0.000000000000E+00
 max value = 0.497499945034E+02
 number of cells =   200
 mean value = 0.305322909355E+01

 writing the output file...

 ~~~~~~~~~~~~~~~~~~~~~~~~~~~~~~~~~~~~~~~~~~

 dtm_local_slope_1 file

 min value = 0.200000E-01
 max value = 0.500000E-01
 number of cells =   200
 mean value = 0.470000E-01

 writing the output file...

 ~~~~~~~~~~~~~~~~~~~~~~~~~~~~~~~~~~~~~~~~~~

 dtm_local_slope_2 file

 min value = 0.000000E+00
 max value = 0.494975E-01
 number of cells =   200
 mean value = 0.356382E-01

 writing the output file...

 ~~~~~~~~~~~~~~~~~~~~~~~~~~~~~~~~~~~~~~~~~~

 dtm_epl_1 file

 min value = 0.500000E+00
 max value = 0.500000E+00
 number of cells =   200
 mean value = 0.500000E+00

 writing the output file...

 ~~~~~~~~~~~~~~~~~~~~~~~~~~~~~~~~~~~~~~~~~~

 dtm_epl_2 file

 min value = 0.000000E+00
 max value = 0.707107E+00
 number of cells =   200
 mean value = 0.509117E+00

 writing the output file...

 ~~~~~~~~~~~~~~~~~~~~~~~~~~~~~~~~~~~~~~~~~~

 dtm_kSs1_sf_1 file

 min value = 0.240040E+02
 max value = 0.240040E+02
 number of cells =   200
 mean value = 0.240040E+02

 writing the output file...

 ~~~~~~~~~~~~~~~~~~~~~~~~~~~~~~~~~~~~~~~~~~

 dtm_kSs1_sf_2 file

 min value = 0.000000E+00
 max value = 0.240040E+02
 number of cells =   200
 mean value = 0.172829E+02

 writing the output file...

 ~~~~~~~~~~~~~~~~~~~~~~~~~~~~~~~~~~~~~~~~~~

 dtm_Ws1_sf file

 min value = 0.100000E+01
 max value = 0.100000E+01
 number of cells =   200
 mean value = 0.100000E+01

 writing the output file...

 ~~~~~~~~~~~~~~~~~~~~~~~~~~~~~~~~~~~~~~~~~~

 dtm_Ws1_sf_2 file

 min value = 0.000000E+00
 max value = 0.100000E+01
 number of cells =   200
 mean value = 0.720000E+00

 writing the output file...

 ~~~~~~~~~~~~~~~~~~~~~~~~~~~~~~~~~~~~~~~~~~

 dtm_b1_sf file

 min value = 0.000000E+00
 max value = 0.000000E+00
 number of cells =   200
 mean value = 0.000000E+00

 writing the output file...

 ~~~~~~~~~~~~~~~~~~~~~~~~~~~~~~~~~~~~~~~~~~

 dtm_y1_sf file

 min value = 0.000000E+00
 max value = 0.000000E+00
 number of cells =   200
 mean value = 0.000000E+00

 writing the output file...

 ~~~~~~~~~~~~~~~~~~~~~~~~~~~~~~~~~~~~~~~~~~

 dtm_hcID file

 min value =     0
 max value =     0
 number of cells =   200
 mean value =     0.000000

 writing the output file...

 ~~~~~~~~~~~~~~~~~~~~~~~~~~~~~~~~~~~~~~~~~~

 dtm_q_output file

 min value =     0
 max value =     0
 number of cells =   200
 mean value =     0.000000

 writing the output file...

 ~~~~~~~~~~~~~~~~~~~~~~~~~~~~~~~~~~~~~~~~~~

 dtm_nrc file

 min value = 0.100000E+01
 max value = 0.100000E+01
 number of cells =   200
 mean value = 0.100000E+01

 writing the output file...

 ...mrbb completed

 bb2shp...

 writing file river_net.shp

Note: The following floating-point exceptions are signalling: IEEE_UNDERFLOW_FLAG IEEE_DENORMAL

🔄 Update parm file
🛠  Recompile src files [3s]
🍳 gfortran compilation [8s]
b''
👟 Run processor
b'\n\n IPRT1=3: Program terminating after output of X, Y, Z coordinate values\n'
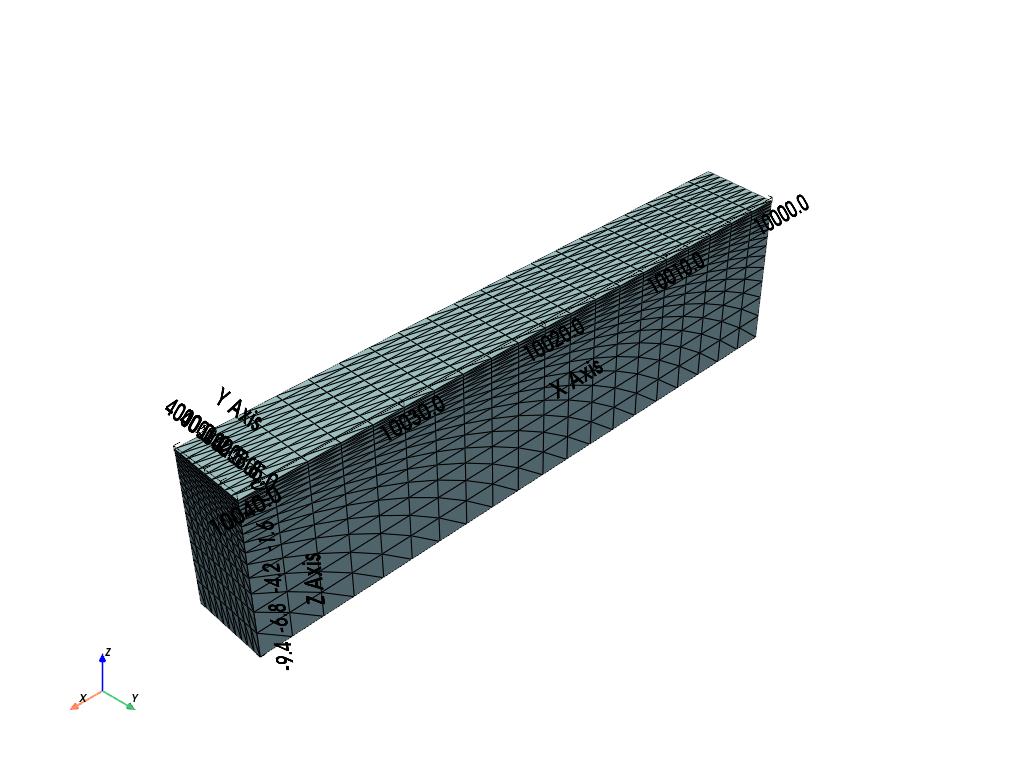
meshfile = rootpath + "/vtk/" + simu.project_name + ".vtk"
import pyvista as pv

mesh2plot = pv.read(meshfile)
mesh2plot.plot(show_edges=True, show_axes=True, show_bounds=True)

maxdepth = 10

# linear z depth
# -------------------------------------------------------------
zb = np.linspace(0, maxdepth, 3)
nstr = len(zb) - 1
zr = list((np.ones(len(zb))) / (nstr))


simu.update_prepo_inputs(
    DEM=dem_mat,
    xllcorner=1e4,
    yllcorner=4e3,
    nstr=nstr,
    zratio=zr,
    base=max(zb),
)
fig = plt.figure()
ax = plt.axes(projection="3d")
simu.show_input(prop="dem", ax=ax)
simu.create_mesh_vtk(verbose=False)

🔄 Update hap.in file
🔄 Update dem_parameters file
─────────────────────────────────────────────────────────────────────────────── ⚠ warning messages above ⚠ ───────────────────────────────────────────────────────────────────────────────
The sum of all the layers is not equal to 1 but to 1.5
──────────────────────────────────────────────────────────────────────────────────────────────────────────────────────────────────────────────────────────────────────────────────────────
🔄 Update dtm_13 file
🔄 update zone file
🔄 Update dem_parameters file
🔄 Update parm file
🔄 Update dem_parameters file
─────────────────────────────────────────────────────────────────────────────── ⚠ warning messages above ⚠ ───────────────────────────────────────────────────────────────────────────────
The sum of all the layers is not equal to 1 but to 1.5
──────────────────────────────────────────────────────────────────────────────────────────────────────────────────────────────────────────────────────────────────────────────────────────
🍳 gfortran compilation
👟 Run preprocessor
🔄 Update parm file
🛠  Recompile src files [12s]
🍳 gfortran compilation [17s]
b''
👟 Run processor
meshfile = rootpath + "/vtk/" + simu.project_name + ".vtk"
import pyvista as pv

mesh2plot = pv.read(meshfile)
mesh2plot.plot(show_edges=True, show_axes=True, show_bounds=True)

# the fraction of total grid height that each layer is to occupy
# log z depth
# -------------------------------------------------------------
zr = np.geomspace(0.1, 1, 15)
print(zr)
zr /= np.sum(zr)
nstr = len(zr)
np.sum(zr)

simu.update_prepo_inputs(
    DEM=dem_mat,
    xllcorner=1e4,
    yllcorner=4e3,
    nstr=20,
    zratio=zr,
    base=max(zb),
)

simu.update_parm(TRAFLAG=0)
simu.create_mesh_vtk(verbose=True)
[0.1        0.11787686 0.13894955 0.16378937 0.19306977 0.22758459
 0.26826958 0.31622777 0.37275937 0.43939706 0.51794747 0.61054023
 0.71968567 0.8483429  1.        ]
🔄 Update hap.in file
🔄 Update dem_parameters file
🔄 Update dtm_13 file
🔄 update zone file
🔄 Update dem_parameters file
🔄 Update parm file
🔄 Update dem_parameters file
🔄 Update parm file
🍳 gfortran compilation
👟 Run preprocessor

 wbb...

 searching the dtm_13.val input file...
 assigned nodata value =  -9999.0000000000000

 number of processed cells =         200

 ...wbb completed

 rn...
 csort I...
 ...completed

 depit...
 dem modifications =            0
 dem modifications =            0 (total)
 ...completed

 csort II...
 ...completed

 cca...

 contour curvature threshold value =    9.99999996E+11
 ...completed

 smean...
 mean (min,max) facet slope =  0.050445386 ( 0.020000000, 0.053851648)
 ...completed

 dsf...
 the drainage direction of the outlet cell (           8 ) is used
 ...completed

 hg...
 ...completed

 saving the data in the basin_b/basin_i files...

 ...rn completed

 mrbb...


 Select the header type:
 0) None
 1) ESRI ascii file
 2) GRASS ascii file
 (Ctrl C to exit)

 ->
 Select the nodata value:
 (Ctrl C to exit)

 ->
 Select the pointer system:
 1) HAP system
 2) Arc/Gis system
 (Ctrl C to exit)

 ->  ~~~~~~~~~~~~~~~~~~~~~~~~~~~~~~~~~~~~~~~~~~

 dem file

 min value = 0.585000E+00
 max value = 0.100000E+01
 number of cells =   200
 mean value = 0.792500E+00

 writing the output file...

 ~~~~~~~~~~~~~~~~~~~~~~~~~~~~~~~~~~~~~~~~~~

 lakes_map file

 min value =     0
 max value =     0
 number of cells =   200
 mean value =     0.000000

 writing the output file...

 ~~~~~~~~~~~~~~~~~~~~~~~~~~~~~~~~~~~~~~~~~~

 zone file

 min value =     1
 max value =     1
 number of cells =   200
 mean value =     1.000000

 writing the output file...

 ~~~~~~~~~~~~~~~~~~~~~~~~~~~~~~~~~~~~~~~~~~

 dtm_w_1 file

 min value = 0.515524E+00
 max value = 0.100000E+01
 number of cells =   200
 mean value = 0.651177E+00

 writing the output file...

 ~~~~~~~~~~~~~~~~~~~~~~~~~~~~~~~~~~~~~~~~~~

 dtm_w_2 file

 min value = 0.000000E+00
 max value = 0.484476E+00
 number of cells =   200
 mean value = 0.348823E+00

 writing the output file...

 ~~~~~~~~~~~~~~~~~~~~~~~~~~~~~~~~~~~~~~~~~~

 dtm_p_outflow_1 file

 min value =     4
 max value =     8
 number of cells =   200
 mean value =     4.400000

 writing the output file...

 ~~~~~~~~~~~~~~~~~~~~~~~~~~~~~~~~~~~~~~~~~~

 dtm_p_outflow_2 file

 min value =     0
 max value =     9
 number of cells =   200
 mean value =     6.885000

 writing the output file...

 ~~~~~~~~~~~~~~~~~~~~~~~~~~~~~~~~~~~~~~~~~~

 A_inflow file

 min value = 0.000000000000E+00
 max value = 0.497499945034E+02
 number of cells =   200
 mean value = 0.305322909355E+01

 writing the output file...

 ~~~~~~~~~~~~~~~~~~~~~~~~~~~~~~~~~~~~~~~~~~

 dtm_local_slope_1 file

 min value = 0.200000E-01
 max value = 0.500000E-01
 number of cells =   200
 mean value = 0.470000E-01

 writing the output file...

 ~~~~~~~~~~~~~~~~~~~~~~~~~~~~~~~~~~~~~~~~~~

 dtm_local_slope_2 file

 min value = 0.000000E+00
 max value = 0.494975E-01
 number of cells =   200
 mean value = 0.356382E-01

 writing the output file...

 ~~~~~~~~~~~~~~~~~~~~~~~~~~~~~~~~~~~~~~~~~~

 dtm_epl_1 file

 min value = 0.500000E+00
 max value = 0.500000E+00
 number of cells =   200
 mean value = 0.500000E+00

 writing the output file...

 ~~~~~~~~~~~~~~~~~~~~~~~~~~~~~~~~~~~~~~~~~~

 dtm_epl_2 file

 min value = 0.000000E+00
 max value = 0.707107E+00
 number of cells =   200
 mean value = 0.509117E+00

 writing the output file...

 ~~~~~~~~~~~~~~~~~~~~~~~~~~~~~~~~~~~~~~~~~~

 dtm_kSs1_sf_1 file

 min value = 0.240040E+02
 max value = 0.240040E+02
 number of cells =   200
 mean value = 0.240040E+02

 writing the output file...

 ~~~~~~~~~~~~~~~~~~~~~~~~~~~~~~~~~~~~~~~~~~

 dtm_kSs1_sf_2 file

 min value = 0.000000E+00
 max value = 0.240040E+02
 number of cells =   200
 mean value = 0.172829E+02

 writing the output file...

 ~~~~~~~~~~~~~~~~~~~~~~~~~~~~~~~~~~~~~~~~~~

 dtm_Ws1_sf file

 min value = 0.100000E+01
 max value = 0.100000E+01
 number of cells =   200
 mean value = 0.100000E+01

 writing the output file...

 ~~~~~~~~~~~~~~~~~~~~~~~~~~~~~~~~~~~~~~~~~~

 dtm_Ws1_sf_2 file

 min value = 0.000000E+00
 max value = 0.100000E+01
 number of cells =   200
 mean value = 0.720000E+00

 writing the output file...

 ~~~~~~~~~~~~~~~~~~~~~~~~~~~~~~~~~~~~~~~~~~

 dtm_b1_sf file

 min value = 0.000000E+00
 max value = 0.000000E+00
 number of cells =   200
 mean value = 0.000000E+00

 writing the output file...

 ~~~~~~~~~~~~~~~~~~~~~~~~~~~~~~~~~~~~~~~~~~

 dtm_y1_sf file

 min value = 0.000000E+00
 max value = 0.000000E+00
 number of cells =   200
 mean value = 0.000000E+00

 writing the output file...

 ~~~~~~~~~~~~~~~~~~~~~~~~~~~~~~~~~~~~~~~~~~

 dtm_hcID file

 min value =     0
 max value =     0
 number of cells =   200
 mean value =     0.000000

 writing the output file...

 ~~~~~~~~~~~~~~~~~~~~~~~~~~~~~~~~~~~~~~~~~~

 dtm_q_output file

 min value =     0
 max value =     0
 number of cells =   200
 mean value =     0.000000

 writing the output file...

 ~~~~~~~~~~~~~~~~~~~~~~~~~~~~~~~~~~~~~~~~~~

 dtm_nrc file

 min value = 0.100000E+01
 max value = 0.100000E+01
 number of cells =   200
 mean value = 0.100000E+01

 writing the output file...

 ...mrbb completed

 bb2shp...

 writing file river_net.shp

Note: The following floating-point exceptions are signalling: IEEE_UNDERFLOW_FLAG IEEE_DENORMAL

🔄 Update parm file
🛠  Recompile src files [21s]
🍳 gfortran compilation [26s]
b''
👟 Run processor
b'\n\n IPRT1=3: Program terminating after output of X, Y, Z coordinate values\n'
meshfile = rootpath + "/vtk/" + simu.project_name + ".vtk"
import pyvista as pv

mesh2plot = pv.read(meshfile)
mesh2plot.plot(show_edges=True, show_axes=True, show_bounds=True)

simu.update_prepo_inputs(
                           DEM=dem_mat,
)
🔄 Update hap.in file
🔄 Update dem_parameters file
🔄 Update dtm_13 file
🔄 update zone file
🔄 Update dem_parameters file
🔄 Update parm file
🔄 Update dem_parameters file
simu.update_dem_parameters(
                            delta_x=2,
                            )
🔄 Update dem_parameters file
simu.update_zone()
simu.update_veg_map()

fig = plt.figure()
ax = plt.axes(projection="3d")
simu.show_input(prop="dem", ax=ax)
simu.create_mesh_vtk(verbose=True)

🔄 update zone file
🔄 Update dem_parameters file
🔄 Update parm file
🍳 gfortran compilation
👟 Run preprocessor

 wbb...

 searching the dtm_13.val input file...
 assigned nodata value =  -9999.0000000000000

 number of processed cells =         200

 ...wbb completed

 rn...
 csort I...
 ...completed

 depit...
 dem modifications =            0
 dem modifications =            0 (total)
 ...completed

 csort II...
 ...completed

 cca...

 contour curvature threshold value =    9.99999996E+11
 ...completed

 smean...
 mean (min,max) facet slope =  0.050445386 ( 0.020000000, 0.053851648)
 ...completed

 dsf...
 the drainage direction of the outlet cell (           8 ) is used
 ...completed

 hg...
 ...completed

 saving the data in the basin_b/basin_i files...

 ...rn completed

 mrbb...


 Select the header type:
 0) None
 1) ESRI ascii file
 2) GRASS ascii file
 (Ctrl C to exit)

 ->
 Select the nodata value:
 (Ctrl C to exit)

 ->
 Select the pointer system:
 1) HAP system
 2) Arc/Gis system
 (Ctrl C to exit)

 ->  ~~~~~~~~~~~~~~~~~~~~~~~~~~~~~~~~~~~~~~~~~~

 dem file

 min value = 0.585000E+00
 max value = 0.100000E+01
 number of cells =   200
 mean value = 0.792500E+00

 writing the output file...

 ~~~~~~~~~~~~~~~~~~~~~~~~~~~~~~~~~~~~~~~~~~

 lakes_map file

 min value =     0
 max value =     0
 number of cells =   200
 mean value =     0.000000

 writing the output file...

 ~~~~~~~~~~~~~~~~~~~~~~~~~~~~~~~~~~~~~~~~~~

 zone file

 min value =     1
 max value =     1
 number of cells =   200
 mean value =     1.000000

 writing the output file...

 ~~~~~~~~~~~~~~~~~~~~~~~~~~~~~~~~~~~~~~~~~~

 dtm_w_1 file

 min value = 0.515524E+00
 max value = 0.100000E+01
 number of cells =   200
 mean value = 0.651177E+00

 writing the output file...

 ~~~~~~~~~~~~~~~~~~~~~~~~~~~~~~~~~~~~~~~~~~

 dtm_w_2 file

 min value = 0.000000E+00
 max value = 0.484476E+00
 number of cells =   200
 mean value = 0.348823E+00

 writing the output file...

 ~~~~~~~~~~~~~~~~~~~~~~~~~~~~~~~~~~~~~~~~~~

 dtm_p_outflow_1 file

 min value =     4
 max value =     8
 number of cells =   200
 mean value =     4.400000

 writing the output file...

 ~~~~~~~~~~~~~~~~~~~~~~~~~~~~~~~~~~~~~~~~~~

 dtm_p_outflow_2 file

 min value =     0
 max value =     9
 number of cells =   200
 mean value =     6.885000

 writing the output file...

 ~~~~~~~~~~~~~~~~~~~~~~~~~~~~~~~~~~~~~~~~~~

 A_inflow file

 min value = 0.000000000000E+00
 max value = 0.497499945034E+02
 number of cells =   200
 mean value = 0.305322909355E+01

 writing the output file...

 ~~~~~~~~~~~~~~~~~~~~~~~~~~~~~~~~~~~~~~~~~~

 dtm_local_slope_1 file

 min value = 0.200000E-01
 max value = 0.500000E-01
 number of cells =   200
 mean value = 0.470000E-01

 writing the output file...

 ~~~~~~~~~~~~~~~~~~~~~~~~~~~~~~~~~~~~~~~~~~

 dtm_local_slope_2 file

 min value = 0.000000E+00
 max value = 0.494975E-01
 number of cells =   200
 mean value = 0.356382E-01

 writing the output file...

 ~~~~~~~~~~~~~~~~~~~~~~~~~~~~~~~~~~~~~~~~~~

 dtm_epl_1 file

 min value = 0.500000E+00
 max value = 0.500000E+00
 number of cells =   200
 mean value = 0.500000E+00

 writing the output file...

 ~~~~~~~~~~~~~~~~~~~~~~~~~~~~~~~~~~~~~~~~~~

 dtm_epl_2 file

 min value = 0.000000E+00
 max value = 0.707107E+00
 number of cells =   200
 mean value = 0.509117E+00

 writing the output file...

 ~~~~~~~~~~~~~~~~~~~~~~~~~~~~~~~~~~~~~~~~~~

 dtm_kSs1_sf_1 file

 min value = 0.240040E+02
 max value = 0.240040E+02
 number of cells =   200
 mean value = 0.240040E+02

 writing the output file...

 ~~~~~~~~~~~~~~~~~~~~~~~~~~~~~~~~~~~~~~~~~~

 dtm_kSs1_sf_2 file

 min value = 0.000000E+00
 max value = 0.240040E+02
 number of cells =   200
 mean value = 0.172829E+02

 writing the output file...

 ~~~~~~~~~~~~~~~~~~~~~~~~~~~~~~~~~~~~~~~~~~

 dtm_Ws1_sf file

 min value = 0.100000E+01
 max value = 0.100000E+01
 number of cells =   200
 mean value = 0.100000E+01

 writing the output file...

 ~~~~~~~~~~~~~~~~~~~~~~~~~~~~~~~~~~~~~~~~~~

 dtm_Ws1_sf_2 file

 min value = 0.000000E+00
 max value = 0.100000E+01
 number of cells =   200
 mean value = 0.720000E+00

 writing the output file...

 ~~~~~~~~~~~~~~~~~~~~~~~~~~~~~~~~~~~~~~~~~~

 dtm_b1_sf file

 min value = 0.000000E+00
 max value = 0.000000E+00
 number of cells =   200
 mean value = 0.000000E+00

 writing the output file...

 ~~~~~~~~~~~~~~~~~~~~~~~~~~~~~~~~~~~~~~~~~~

 dtm_y1_sf file

 min value = 0.000000E+00
 max value = 0.000000E+00
 number of cells =   200
 mean value = 0.000000E+00

 writing the output file...

 ~~~~~~~~~~~~~~~~~~~~~~~~~~~~~~~~~~~~~~~~~~

 dtm_hcID file

 min value =     0
 max value =     0
 number of cells =   200
 mean value =     0.000000

 writing the output file...

 ~~~~~~~~~~~~~~~~~~~~~~~~~~~~~~~~~~~~~~~~~~

 dtm_q_output file

 min value =     0
 max value =     0
 number of cells =   200
 mean value =     0.000000

 writing the output file...

 ~~~~~~~~~~~~~~~~~~~~~~~~~~~~~~~~~~~~~~~~~~

 dtm_nrc file

 min value = 0.100000E+01
 max value = 0.100000E+01
 number of cells =   200
 mean value = 0.100000E+01

 writing the output file...

 ...mrbb completed

 bb2shp...

 writing file river_net.shp

Note: The following floating-point exceptions are signalling: IEEE_UNDERFLOW_FLAG IEEE_DENORMAL

🔄 Update parm file
🛠  Recompile src files [30s]
🍳 gfortran compilation [35s]
b''
👟 Run processor
b'\n\n IPRT1=3: Program terminating after output of X, Y, Z coordinate values\n'
meshfile = rootpath + "/vtk/" + simu.project_name + ".vtk"
import pyvista as pv

mesh2plot = pv.read(meshfile)
mesh2plot.plot(show_edges=True, show_axes=True, show_bounds=True)
the new dimension of the mesh is rectangle (10,20)
dem_crop = dem_mat[0:10, :]
print("DEM shape is {}".format(np.shape(dem_crop)))

simu.update_prepo_inputs(
    DEM=dem_crop,
)

simu.update_zone()
simu.update_veg_map()

fig = plt.figure()
ax = plt.axes(projection="3d")
simu.show_input(prop="dem", ax=ax)
simu.create_mesh_vtk(verbose=True)

DEM shape is (10, 20)
🔄 Update hap.in file
🔄 Update dem_parameters file
🔄 Update dtm_13 file
🔄 update zone file
🔄 Update dem_parameters file
🔄 Update parm file
🔄 Update dem_parameters file
🔄 update zone file
🔄 Update dem_parameters file
🔄 Update parm file
🍳 gfortran compilation
👟 Run preprocessor

 wbb...

 searching the dtm_13.val input file...
 assigned nodata value =  -9999.0000000000000

 number of processed cells =         200

 ...wbb completed

 rn...
 csort I...
 ...completed

 depit...
 dem modifications =            0
 dem modifications =            0 (total)
 ...completed

 csort II...
 ...completed

 cca...

 contour curvature threshold value =    9.99999996E+11
 ...completed

 smean...
 mean (min,max) facet slope =  0.050445386 ( 0.020000000, 0.053851648)
 ...completed

 dsf...
 the drainage direction of the outlet cell (           8 ) is used
 ...completed

 hg...
 ...completed

 saving the data in the basin_b/basin_i files...

 ...rn completed

 mrbb...


 Select the header type:
 0) None
 1) ESRI ascii file
 2) GRASS ascii file
 (Ctrl C to exit)

 ->
 Select the nodata value:
 (Ctrl C to exit)

 ->
 Select the pointer system:
 1) HAP system
 2) Arc/Gis system
 (Ctrl C to exit)

 ->  ~~~~~~~~~~~~~~~~~~~~~~~~~~~~~~~~~~~~~~~~~~

 dem file

 min value = 0.585000E+00
 max value = 0.100000E+01
 number of cells =   200
 mean value = 0.792500E+00

 writing the output file...

 ~~~~~~~~~~~~~~~~~~~~~~~~~~~~~~~~~~~~~~~~~~

 lakes_map file

 min value =     0
 max value =     0
 number of cells =   200
 mean value =     0.000000

 writing the output file...

 ~~~~~~~~~~~~~~~~~~~~~~~~~~~~~~~~~~~~~~~~~~

 zone file

 min value =     1
 max value =     1
 number of cells =   200
 mean value =     1.000000

 writing the output file...

 ~~~~~~~~~~~~~~~~~~~~~~~~~~~~~~~~~~~~~~~~~~

 dtm_w_1 file

 min value = 0.515524E+00
 max value = 0.100000E+01
 number of cells =   200
 mean value = 0.651177E+00

 writing the output file...

 ~~~~~~~~~~~~~~~~~~~~~~~~~~~~~~~~~~~~~~~~~~

 dtm_w_2 file

 min value = 0.000000E+00
 max value = 0.484476E+00
 number of cells =   200
 mean value = 0.348823E+00

 writing the output file...

 ~~~~~~~~~~~~~~~~~~~~~~~~~~~~~~~~~~~~~~~~~~

 dtm_p_outflow_1 file

 min value =     4
 max value =     8
 number of cells =   200
 mean value =     4.400000

 writing the output file...

 ~~~~~~~~~~~~~~~~~~~~~~~~~~~~~~~~~~~~~~~~~~

 dtm_p_outflow_2 file

 min value =     0
 max value =     9
 number of cells =   200
 mean value =     6.885000

 writing the output file...

 ~~~~~~~~~~~~~~~~~~~~~~~~~~~~~~~~~~~~~~~~~~

 A_inflow file

 min value = 0.000000000000E+00
 max value = 0.497499945034E+02
 number of cells =   200
 mean value = 0.305322909355E+01

 writing the output file...

 ~~~~~~~~~~~~~~~~~~~~~~~~~~~~~~~~~~~~~~~~~~

 dtm_local_slope_1 file

 min value = 0.200000E-01
 max value = 0.500000E-01
 number of cells =   200
 mean value = 0.470000E-01

 writing the output file...

 ~~~~~~~~~~~~~~~~~~~~~~~~~~~~~~~~~~~~~~~~~~

 dtm_local_slope_2 file

 min value = 0.000000E+00
 max value = 0.494975E-01
 number of cells =   200
 mean value = 0.356382E-01

 writing the output file...

 ~~~~~~~~~~~~~~~~~~~~~~~~~~~~~~~~~~~~~~~~~~

 dtm_epl_1 file

 min value = 0.500000E+00
 max value = 0.500000E+00
 number of cells =   200
 mean value = 0.500000E+00

 writing the output file...

 ~~~~~~~~~~~~~~~~~~~~~~~~~~~~~~~~~~~~~~~~~~

 dtm_epl_2 file

 min value = 0.000000E+00
 max value = 0.707107E+00
 number of cells =   200
 mean value = 0.509117E+00

 writing the output file...

 ~~~~~~~~~~~~~~~~~~~~~~~~~~~~~~~~~~~~~~~~~~

 dtm_kSs1_sf_1 file

 min value = 0.240040E+02
 max value = 0.240040E+02
 number of cells =   200
 mean value = 0.240040E+02

 writing the output file...

 ~~~~~~~~~~~~~~~~~~~~~~~~~~~~~~~~~~~~~~~~~~

 dtm_kSs1_sf_2 file

 min value = 0.000000E+00
 max value = 0.240040E+02
 number of cells =   200
 mean value = 0.172829E+02

 writing the output file...

 ~~~~~~~~~~~~~~~~~~~~~~~~~~~~~~~~~~~~~~~~~~

 dtm_Ws1_sf file

 min value = 0.100000E+01
 max value = 0.100000E+01
 number of cells =   200
 mean value = 0.100000E+01

 writing the output file...

 ~~~~~~~~~~~~~~~~~~~~~~~~~~~~~~~~~~~~~~~~~~

 dtm_Ws1_sf_2 file

 min value = 0.000000E+00
 max value = 0.100000E+01
 number of cells =   200
 mean value = 0.720000E+00

 writing the output file...

 ~~~~~~~~~~~~~~~~~~~~~~~~~~~~~~~~~~~~~~~~~~

 dtm_b1_sf file

 min value = 0.000000E+00
 max value = 0.000000E+00
 number of cells =   200
 mean value = 0.000000E+00

 writing the output file...

 ~~~~~~~~~~~~~~~~~~~~~~~~~~~~~~~~~~~~~~~~~~

 dtm_y1_sf file

 min value = 0.000000E+00
 max value = 0.000000E+00
 number of cells =   200
 mean value = 0.000000E+00

 writing the output file...

 ~~~~~~~~~~~~~~~~~~~~~~~~~~~~~~~~~~~~~~~~~~

 dtm_hcID file

 min value =     0
 max value =     0
 number of cells =   200
 mean value =     0.000000

 writing the output file...

 ~~~~~~~~~~~~~~~~~~~~~~~~~~~~~~~~~~~~~~~~~~

 dtm_q_output file

 min value =     0
 max value =     0
 number of cells =   200
 mean value =     0.000000

 writing the output file...

 ~~~~~~~~~~~~~~~~~~~~~~~~~~~~~~~~~~~~~~~~~~

 dtm_nrc file

 min value = 0.100000E+01
 max value = 0.100000E+01
 number of cells =   200
 mean value = 0.100000E+01

 writing the output file...

 ...mrbb completed

 bb2shp...

 writing file river_net.shp

Note: The following floating-point exceptions are signalling: IEEE_UNDERFLOW_FLAG IEEE_DENORMAL

🔄 Update parm file
🛠  Recompile src files [39s]
🍳 gfortran compilation [44s]
b''
👟 Run processor
b'\n\n IPRT1=3: Program terminating after output of X, Y, Z coordinate values\n'
meshfile = rootpath + "/vtk/" + simu.project_name + ".vtk"
import pyvista as pv

mesh2plot = pv.read(meshfile)
mesh2plot.plot(show_edges=True, show_axes=True, show_bounds=True)

meshfile = rootpath + "/vtk/" + simu.project_name + ".vtk"
import pyvista as pv

mesh2plot = pv.read(meshfile)
mesh2plot.plot(show_edges=True, show_axes=True, show_bounds=True)

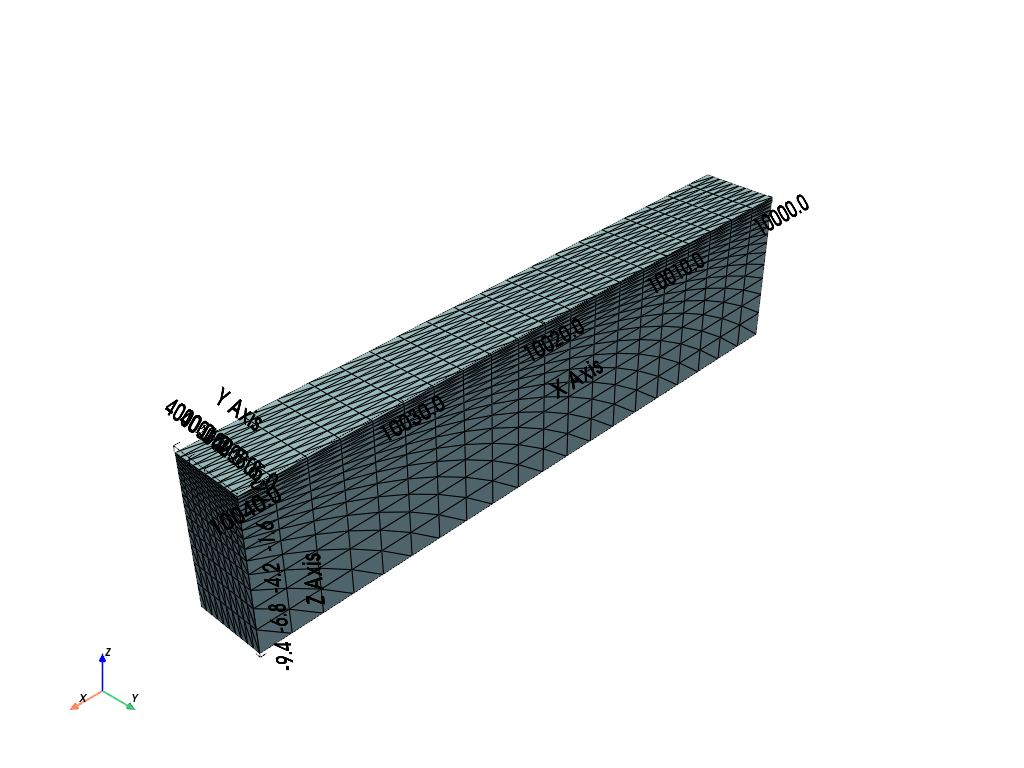
simu.update_prepo_inputs(
    DEM=dem_crop,
    xllcorner=1e4,
    yllcorner=4e3,
)

simu.update_zone()
simu.update_veg_map()

fig = plt.figure()
ax = plt.axes(projection="3d")
simu.show_input(prop="dem", ax=ax)
simu.create_mesh_vtk(verbose=False)

🔄 Update hap.in file
🔄 Update dem_parameters file
🔄 Update dtm_13 file
🔄 update zone file
🔄 Update dem_parameters file
🔄 Update parm file
🔄 Update dem_parameters file
🔄 update zone file
🔄 Update dem_parameters file
🔄 Update parm file
🍳 gfortran compilation
👟 Run preprocessor
🔄 Update parm file
🛠  Recompile src files [49s]
🍳 gfortran compilation [54s]
b''
👟 Run processor
meshfile = rootpath + "/vtk/" + simu.project_name + ".vtk"
import pyvista as pv

mesh2plot = pv.read(meshfile)
mesh2plot.plot(show_edges=True, show_axes=True, show_bounds=True)

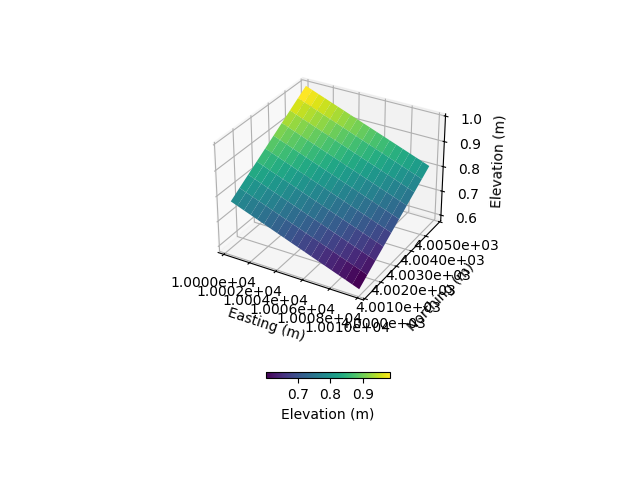
dem_crop_flipy = np.flipud(dem_crop)

simu.update_prepo_inputs(
    DEM=dem_crop_flipy,
    xllcorner=1e4,
    yllcorner=4e3,
)

simu.update_zone()
simu.update_veg_map()
fig = plt.figure()
ax = plt.axes(projection="3d")
simu.show_input(prop="dem", ax=ax)
simu.create_mesh_vtk(verbose=False)
🔄 Update hap.in file
🔄 Update dem_parameters file
🔄 Update dtm_13 file
🔄 update zone file
🔄 Update dem_parameters file
🔄 Update parm file
🔄 Update dem_parameters file
🔄 update zone file
🔄 Update dem_parameters file
🔄 Update parm file
🍳 gfortran compilation
👟 Run preprocessor
🔄 Update parm file
🛠  Recompile src files [58s]
🍳 gfortran compilation [63s]
b''
👟 Run processor
meshfile = rootpath + "/vtk/" + simu.project_name + ".vtk"
import pyvista as pv

mesh2plot = pv.read(meshfile)
mesh2plot.plot(show_edges=True, show_axes=True, show_bounds=True)
#simu.run_processor(IPRT1=2, verbose=True)
Total running time of the script: (1 minutes 3.584 seconds)