Note
Go to the end to download the full example code.
Input plots#
Weill, S., et al. « Coupling Water Flow and Solute Transport into a Physically-Based Surface–Subsurface Hydrological Model ». Advances in Water Resources, vol. 34, no 1, janvier 2011, p. 128‑36. DOI.org (Crossref), https://doi.org/10.1016/j.advwatres.2010.10.001.
This example shows how to use pyCATHY object to plot inputs of the hydrological model.
Estimated time to run the notebook = 5min
# map_prop_veg ?
# map_prop2zone
import numpy as np

from pyCATHY import cathy_tools
from pyCATHY.plotters import cathy_plots as cplt
path2prj = "../SSHydro/"  # add your local path here
simu = cathy_tools.CATHY(dirName=path2prj,
                    prj_name="weill_exemple_input_plots"
                    )

# simu.run_preprocessor()
🏁 Initiate CATHY object
simu.show_input(prop=”dem”)
# show time atmbc
# simu.show_input(prop='atmbc')

# In progress --> show spatial atmbc

# simu.update_dem_parameters()
# simu.update_prepo_inputs()
Add a new zone
simu.update_prepo_inputs()
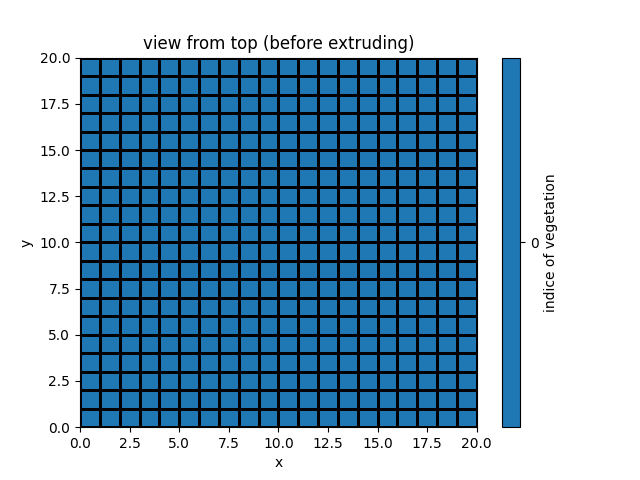
simu.update_veg_map(np.ones([int(simu.hapin['N']),int(simu.hapin['M'])]))
simu.update_zone(np.ones([int(simu.hapin['N']),int(simu.hapin['M'])]))
simu.show_input(prop="root_map")
# simu.update_soil()
🔄 Update hap.in file
🔄 Update dem_parameters file
🔄 Update dem_parameters file
─────────────────────────────────────────────────────────────────────────────── ⚠ warning messages above ⚠ ───────────────────────────────────────────────────────────────────────────────

                            The parm dictionnary is empty
                            Falling back to defaults to update CATHYH
                            This can have consequences !!

──────────────────────────────────────────────────────────────────────────────────────────────────────────────────────────────────────────────────────────────────────────────────────────
🔄 Update parm file
🔄 update zone file
🔄 Update dem_parameters file
🔄 Update parm file
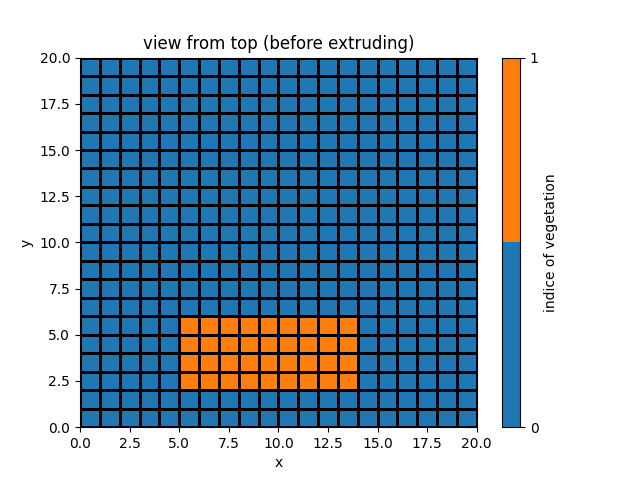
veg_map = simu.veg_map
veg_map[2:6, 5:14] = 2
simu.update_veg_map(veg_map)
simu.show_input(prop="root_map")
Feddes is a dictionnary with 6 entries, and for each a list
# _, df_soil_FP = simu.read_inputs('soil',MAXVEG=1)
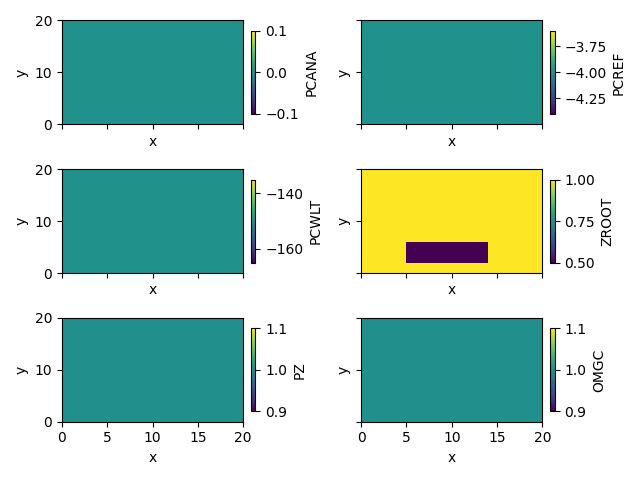
df_soil_FP_2veg = simu.init_soil_FP_map_df(nveg=2)
df_soil_FP_2veg = simu.set_SOIL_defaults(FP_map_default=True)
# FP_map_1zone = simu.soil_FP["FP_map"] # read existing mapping
# FP_map_2zones = {}
for k in df_soil_FP_2veg.keys():
if k == "ZROOT":
ZROOT_zone2 = df_soil_FP_2veg["ZROOT"].values[0] / 2
df_soil_FP_2veg[k] = [df_soil_FP_2veg[k].values[0], ZROOT_zone2]
else:
df_soil_FP_2veg[k] = [df_soil_FP_2veg[k].values[0], df_soil_FP_2veg[k].values[0]]
# simu.show_input(prop='soil', yprop='ZROOT', layer_nb=12)
simu.update_soil(FP_map=df_soil_FP_2veg, show=True)

# simu.update_zone(veg_map)
# simu.update_veg_map(veg_map)

simu.show_input(prop="soil", yprop="PERMX", layer_nb=4)

# Here we can imaging to get a more complexe vegetation map from remote sensing data instead

🔄 Update soil
homogeneous soil

<matplotlib.collections.QuadMesh object at 0x7fa9b131fd60>
simu.update_prepo_inputs()
🔄 Update hap.in file
🔄 Update dem_parameters file
🔄 Update dem_parameters file
This will automatically create a new vtk mesh containing the zone flags error –> number of tretra in grid3d < n of tretra in the mesh (mission one element)
simu.update_zone()
🔄 update zone file
🔄 Update dem_parameters file
🔄 Update parm file
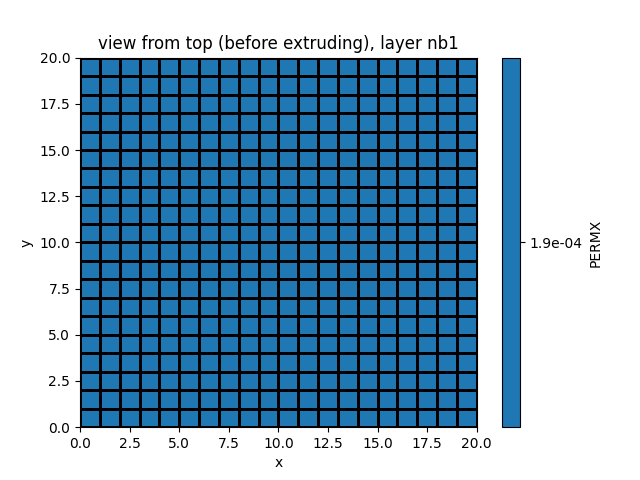
simu.show_input(prop="soil", yprop="PERMX", layer_nb=1)
simu.show_input(prop="soil", yprop="POROS", layer_nb=2)

<matplotlib.collections.QuadMesh object at 0x7fa9a9157df0>
Show layer number 10
simu.show_input(prop="soil", yprop="VGNCELL", layer_nb=10)

<matplotlib.collections.QuadMesh object at 0x7fa9a90731f0>
simu.update_soil()
df_soil, _ = simu.read_inputs("soil")
df = simu.read_inputs("soil")
🔄 Update soil
homogeneous soil
zones = simu.zone
simu.update_prepo_inputs()
zones[5:14, 5:14] = 2
simu.update_zone(zones)
simu.show_input(prop="zone")
🔄 Update hap.in file
🔄 Update dem_parameters file
🔄 Update dem_parameters file
🔄 update zone file
🔄 Update dem_parameters file
🔄 Update parm file
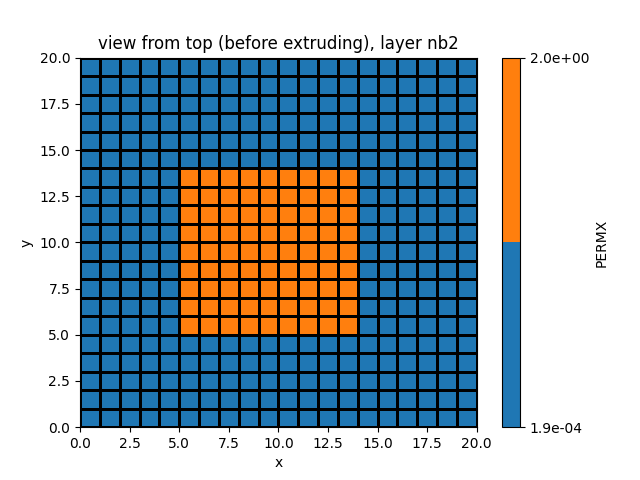
we just need to build a dictionnary as: {property: [value_zone1, value_zone2]} or a panda dataframe
df_SPP_map = simu.init_soil_SPP_map_df(nzones=2,nstr=15)
SPP_map_2zones = simu.set_SOIL_defaults(SPP_map_default=True)

SPP_map_2zones.xs(2).loc[:,'PERMX'] = 0.000188/5

simu.update_soil(SPP_map=SPP_map_2zones)
🔄 Update soil
homogeneous soil
simu.show_input(prop="soil", yprop="PERMX", layer_nb=2)
<matplotlib.collections.QuadMesh object at 0x7fa9a902a9e0>
simu.show_input(prop="soil", yprop="PERMX", layer_nb=12)

<matplotlib.collections.QuadMesh object at 0x7fa9a64d8f70>
Total running time of the script: (0 minutes 0.827 seconds)