Note
Go to the end to download the full example code.
Weill et al example#
Weill, S., et al. « Coupling Water Flow and Solute Transport into a Physically-Based Surface–Subsurface Hydrological Model ». Advances in Water Resources, vol. 34, no 1, janvier 2011, p. 128‑36. DOI.org (Crossref), https://doi.org/10.1016/j.advwatres.2010.10.001.
The CATHY gitbucket repository provides the Weill et al. dataset example to test the installation. On top of that, we provide a computational notebook code to reproduce the results using the pyCATHY wrapper (BenjMy/pycathy_wrapper).
The notebook illustrate how to work interactively: execute single cell, see partial results at different processing steps (preprocessing, processing, output)… You can share it to work collaboratively on it by sharing the link and execute it from another PC without any installation required.
Estimated time to run the notebook = 5min
# In[2]:

from pyCATHY import cathy_tools
from pyCATHY.plotters import cathy_plots as cplt
import pyvista as pv

# In[13]:

path2prj = "../SSHydro/"  # add your local path here
simu = cathy_tools.CATHY(dirName=path2prj,
                    prj_name="weill_exemple"
                    )
🏁 Initiate CATHY object
simu.run_preprocessor(verbose=False)
# simu.run_processor(IPRT1=3,verbose=True)

# simu.read_inputs('atmbc')
simu.update_parm(TIMPRTi=[1800,7200],
                 VTKF=2
                 )

# simu.atmbc
# simu.parm
# simu.update_parm(VTKF=2)

# simu.grid3d
# len(simu.grid3d["mesh_tetra"])
simu.run_processor(IPRT1=2,
                    DTMIN=1e-2,
                    DTMAX=1e2,
                    DELTAT=5,
                    TRAFLAG=0,
                    verbose=False
                    )
🍳 gfortran compilation
👟 Run preprocessor
🔄 Update parm file
🔄 Update hap.in file
🔄 Update dem_parameters file
🔄 Update dem_parameters file
🔄 Update parm file
🛠  Recompile src files [4s]
🍳 gfortran compilation [11s]
✅ Compilation successful!
👟 Run processor
pl = pv.Plotter(notebook=False)
cplt.show_vtk(unit="pressure",
              timeStep=1,
              path=simu.workdir + "/weill_exemple/vtk/",
              ax=pl,
              )
pl.show()
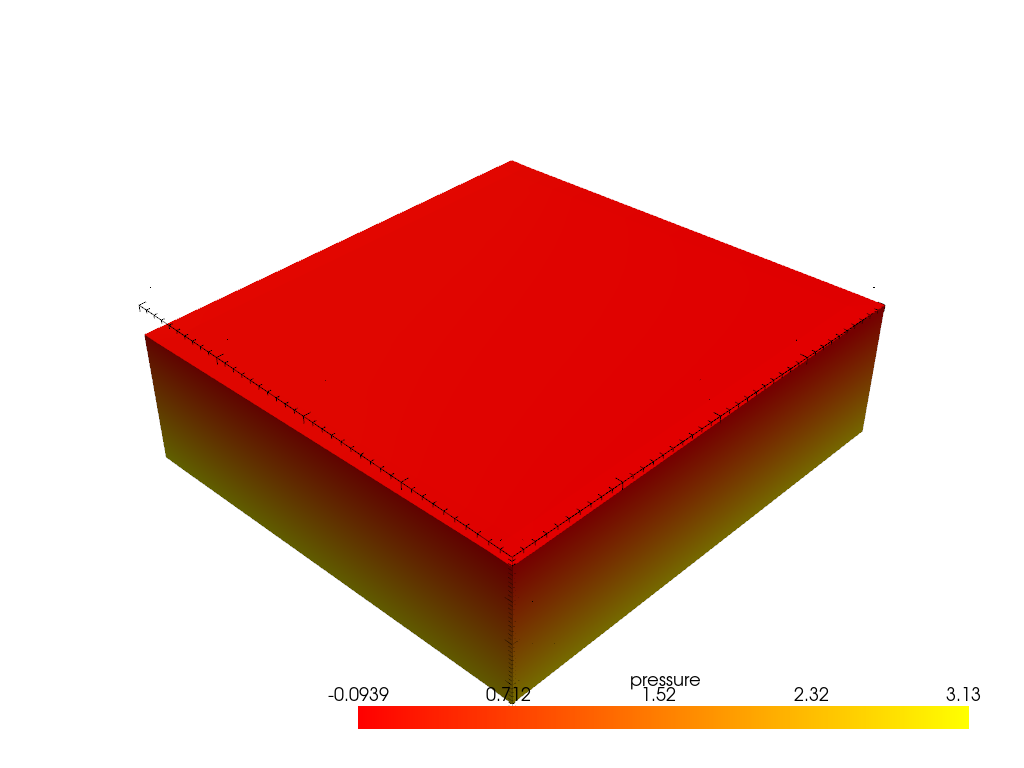
plot pressure
pl = pv.Plotter(notebook=True)
cplt.show_vtk(unit="pressure",
              timeStep=1,
              path=simu.workdir + "/weill_exemple/vtk/",
              ax=pl,
              )
pl.show()
plot pressure
/home/z0272571a@campus.csic.es/Nextcloud/BenCSIC/Codes/BenjMy/pycathy_wrapper/examples/SSHydro/plot_1_pyCATHY_weilletal.py:75: UserWarning: Using static image for notebook display.
Install trame for interactive backends: pip install trame-pyvista
  pl.show()
<PIL.Image.Image image mode=RGB size=2048x1536 at 0x7A4E2827BC10>
cplt.show_vtk_TL(
                unit="pressure",
                notebook=False,
                path=simu.workdir + "/weill_exemple/vtk/",
                show=False,
                x_units='days',
                clim = [0.55,0.70],
                savefig=True,
            )
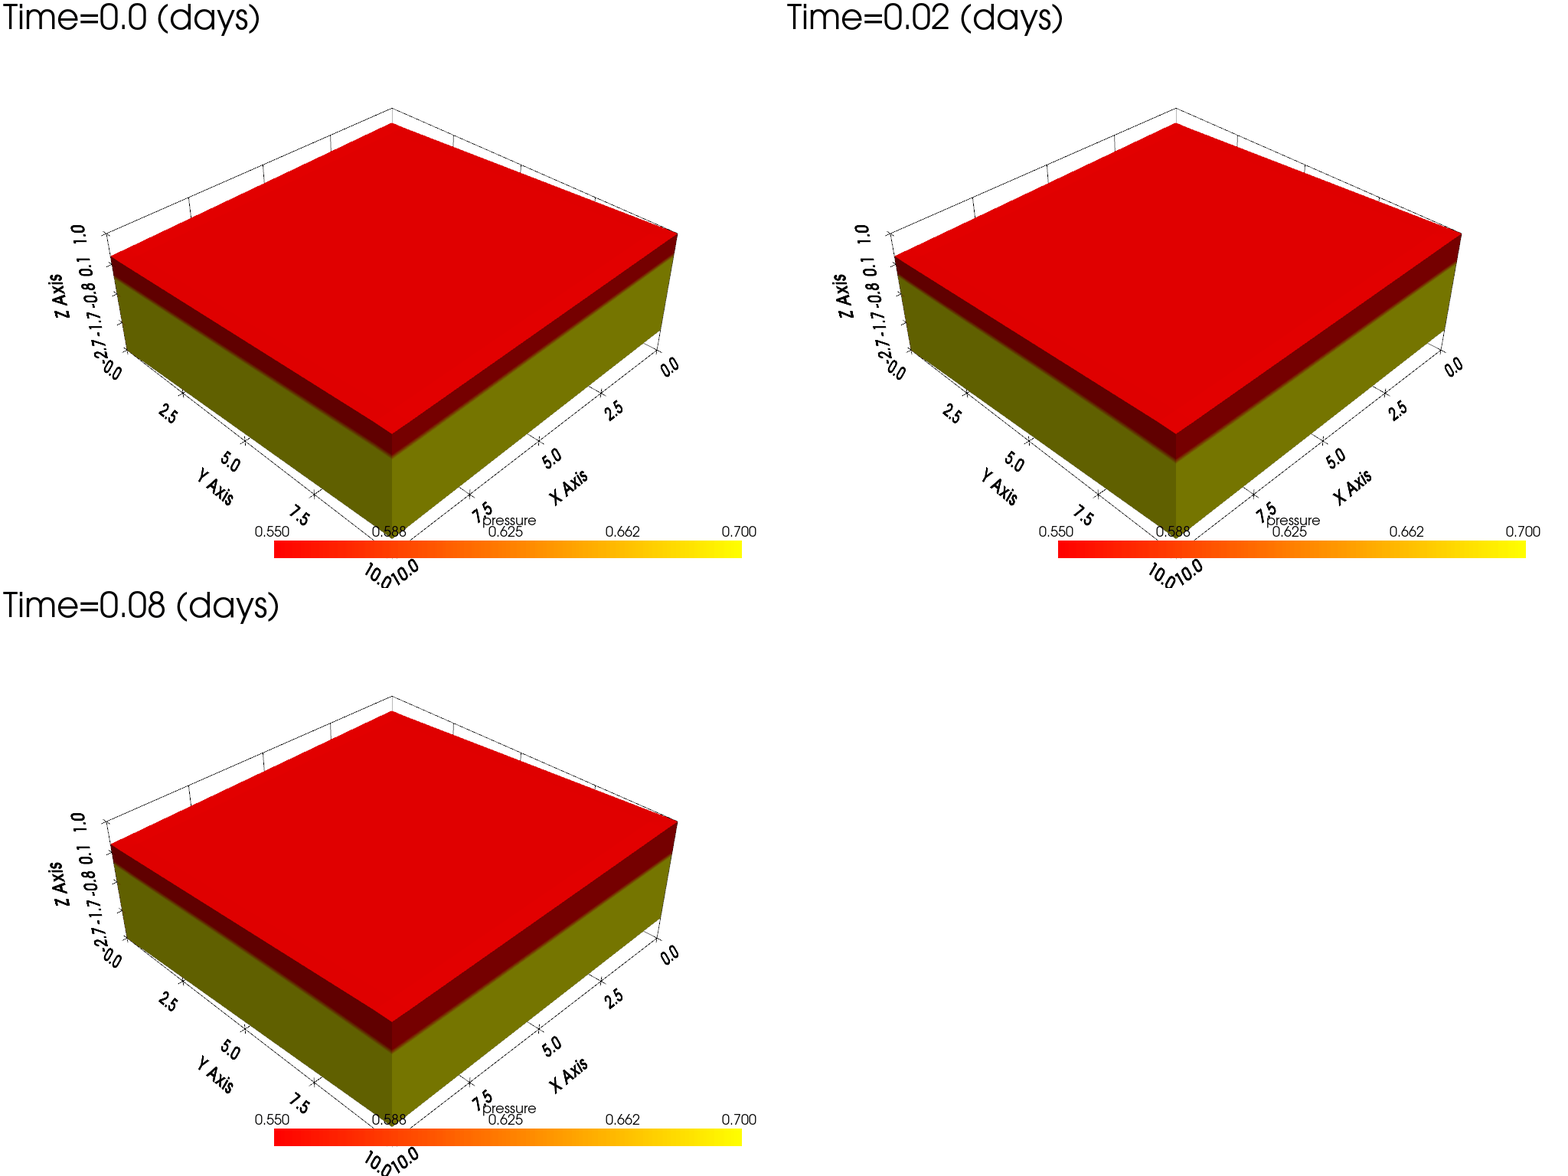
days
plot pressure
Time= [0.]
/home/z0272571a@campus.csic.es/Nextcloud/BenCSIC/Codes/BenjMy/pycathy_wrapper/examples/SSHydro/../SSHydro//weill_exemple/vtk/100 (conflicted copy 2026-09-07 154107).vtk
[0.]
/home/z0272571a@campus.csic.es/Nextcloud/BenCSIC/Codes/BenjMy/pycathy_wrapper/examples/SSHydro/../SSHydro//weill_exemple/vtk/100.vtk
[0.]
/home/z0272571a@campus.csic.es/Nextcloud/BenCSIC/Codes/BenjMy/pycathy_wrapper/examples/SSHydro/../SSHydro//weill_exemple/vtk/101 (conflicted copy 2026-09-07 154116).vtk
[1802.31163]
/home/z0272571a@campus.csic.es/Nextcloud/BenCSIC/Codes/BenjMy/pycathy_wrapper/examples/SSHydro/../SSHydro//weill_exemple/vtk/101.vtk
[1895.11582]
/home/z0272571a@campus.csic.es/Nextcloud/BenCSIC/Codes/BenjMy/pycathy_wrapper/examples/SSHydro/../SSHydro//weill_exemple/vtk/102 (conflicted copy 2026-09-07 154122).vtk
[7200.]
/home/z0272571a@campus.csic.es/Nextcloud/BenCSIC/Codes/BenjMy/pycathy_wrapper/examples/SSHydro/../SSHydro//weill_exemple/vtk/102.vtk
[7200.]
/home/z0272571a@campus.csic.es/Nextcloud/BenCSIC/Codes/BenjMy/pycathy_wrapper/examples/SSHydro/../SSHydro//weill_exemple/vtk/103 (conflicted copy 2026-09-07 154122).vtk
[7200.]
/home/z0272571a@campus.csic.es/Nextcloud/BenCSIC/Codes/BenjMy/pycathy_wrapper/examples/SSHydro/../SSHydro//weill_exemple/vtk/103.vtk
[7200.]
gif saved/home/z0272571a@campus.csic.es/Nextcloud/BenCSIC/Codes/BenjMy/pycathy_wrapper/examples/SSHydro/../SSHydro//weill_exemple/vtk/pressure.gif
Total running time of the script: (0 minutes 19.527 seconds)